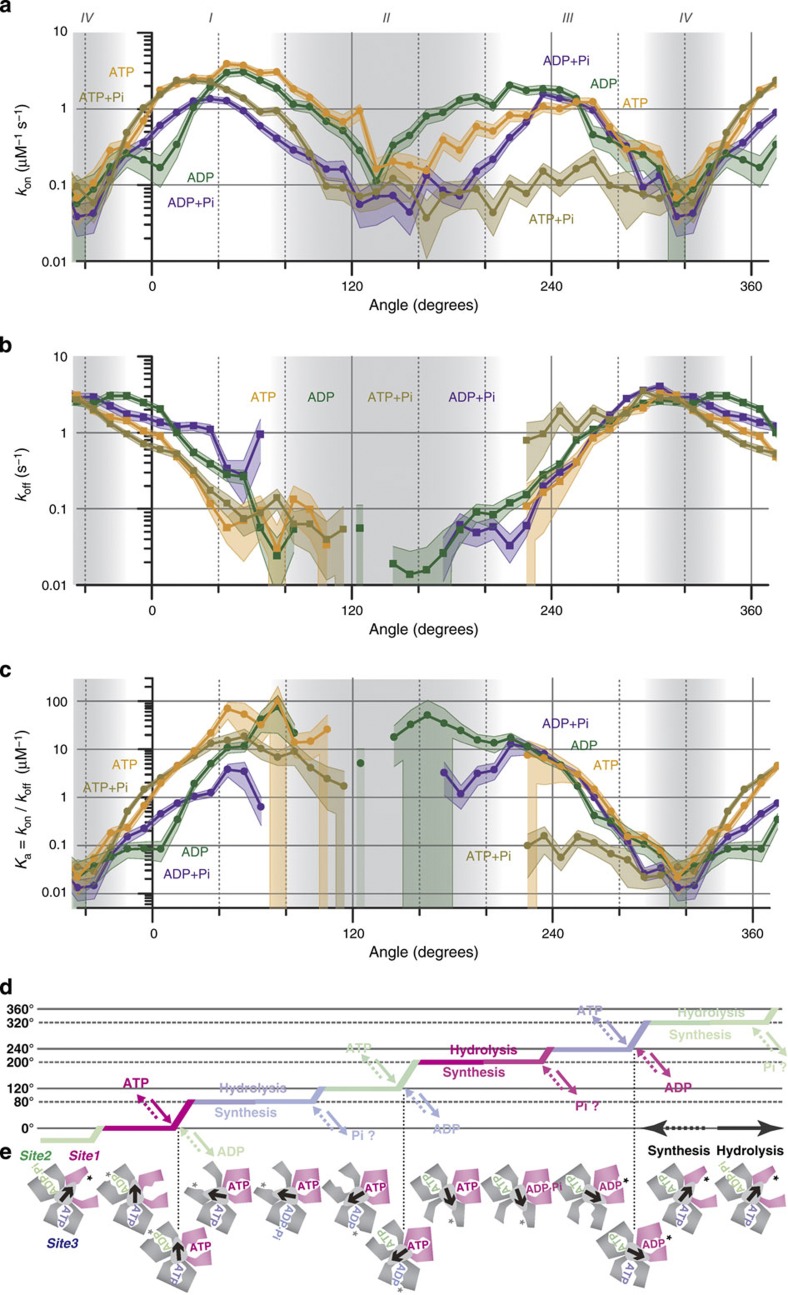
Figure 6. Summary of angle-dependent binding changes in site 1.
(a,b) Averaged rate constants for binding, kon (a), and for release, koff (b), from Fig. 5 for the indicated nucleotides ('Cy3-' is omitted). (c) Association constants calculated from a and b, Ka=kon/koff. Error shades in a and b represent relative errors of n−1/2 where n is the total event count per Δθ. Relative errors in c are (1/non+1/noff)1/2. Grey shades distinguish regions I–IV defined at the top. (d) Schematic time course of stepping rotation. Vertical axis is the γ angle, and horizontal axis time. Colours show the catalytic site in e where the indicated reaction occurs. Solid arrows, hydrolysis; dotted arrows, synthesis. Pi timings are yet unclear at present. (e) Schematic representation of the γ angle (arrow) and closing/opening of the three catalytic sites. Site 1 (magenta) is defined as the site that waits for ATP at 0° during stepping rotation. Some or all asterisks may be Pi.

