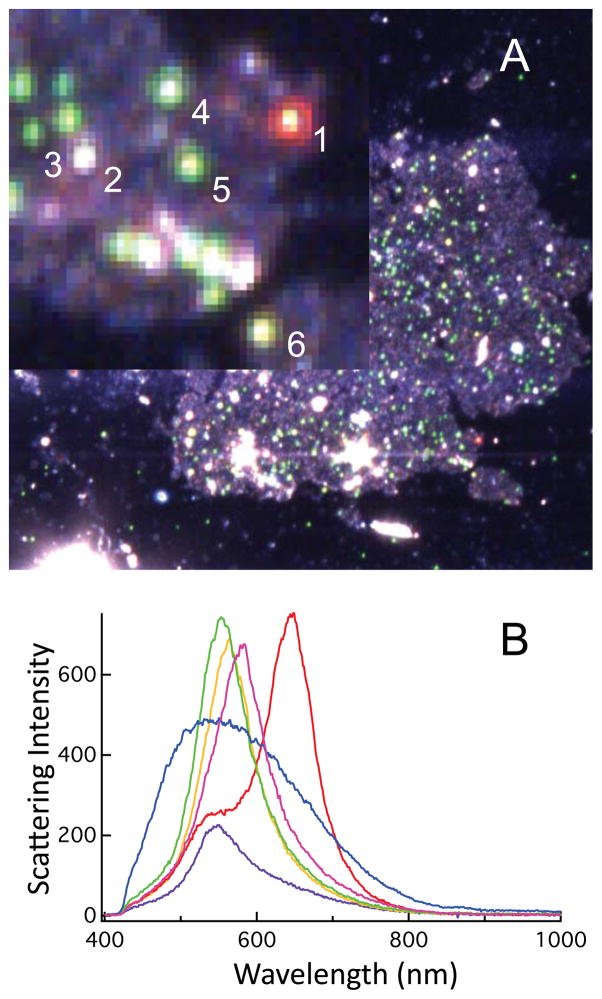
Figure 1.
The dark field image of our 50 nm conjugated nanoparticles affixed to cells is shown in A. The inset is a blow-up of the area marked by the red box. The spectrum obtained from the circled particles are plotted in B. Individual particles exhibit small differences in their scattering maxima suggesting multiple particles within the diffraction limited focus with weak coupling interactions, while aggregated particles (e.g.- particle 1) are detected by their red color and characteristic spectral profile (red). Particles that are not Au (e.g.- particle 2) are evident by the different scattering profile they evince (blue). The purple, green, yellow, and magenta spectra correspond to particles 3, 4, 5, and 6, respectively.

