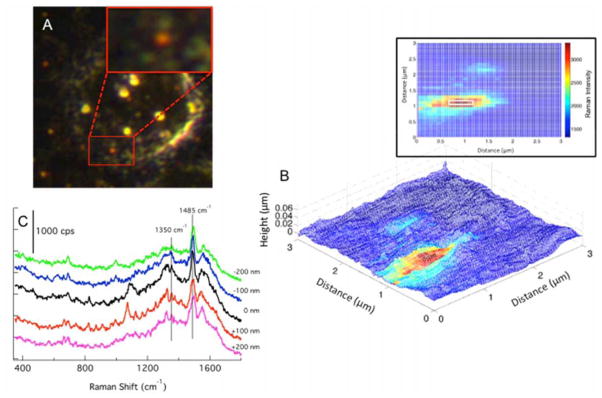
Figure 3.
(A) The dark field image of a single cell is shown. The region scanned by TERS is shown in the red box and enlarged in the inset. (B) The AFM topography is overlaid with the Raman map from the baseline subtracted intensity of the peak at 1575 cm−1. The Raman map in 2-D is shown (inset) to help visualize the dimensions of the nanoparticle cluster detected in the far field image and by TERS. (C) The spectrum from 5 pixels (white box, inset of B) across the center of the high intensity area are plotted. The spectrum from the cluster shows signals at 1350 and 1485 cm−1 consistent with the conjugated nanoparticles (Fig. S2) and that of the spectrum of a single Au NP shown in Fig. 2C; however, the spectra also contain many signals not directly attributed to the IgG antibody.

