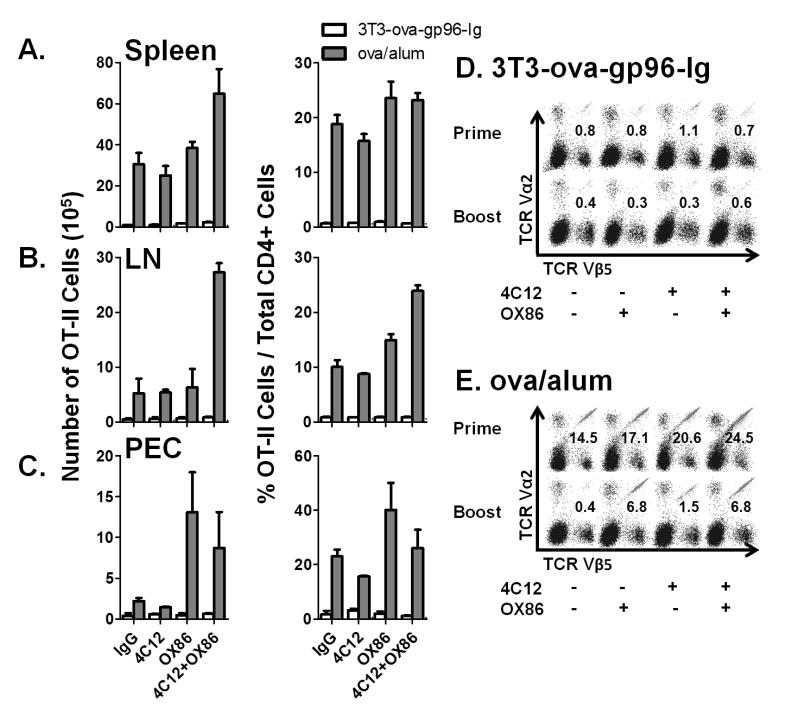
Figure 5. Tissue distribution and response of OT-II to secondary immunization.
The indicated groups were treated as shown in Figure 4 and the absolute numbers (left column) and frequencies (right column) of OT-II cells in the A) spleen, B) lymph nodes or C) peritoneal cavity determined on day 5 following primary immunization. Certain groups treated as indicated in (A-C) were monitored until day 52 following the primary immunization, at which time they were treated with a secondary immunization with D) 3T3-ova-gp96-Ig or E) ova/alum together with the indicated antibodies. Representative flow cytometry plots of splenocytes analyzed on day 57 and pre-gated on CD3+CD4+ cells are shown. The percentage of TCR Vα2+, Vβ5+ double-positive cells are overlayed on each plot. Data indicate mean ± SEM for 2 independent experiments.

