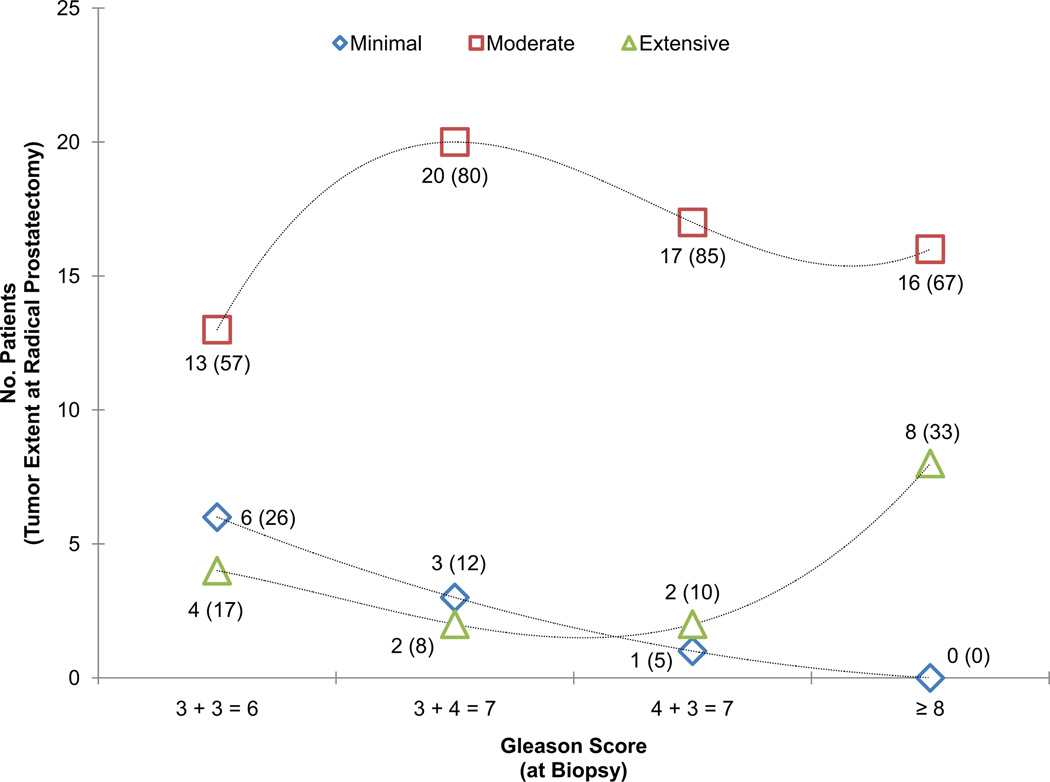
Figure 1.
Tumor extension at radical prostatectomy by Gleason score groups at biopsy. Geometrical shapes represent the total number of cases for any given category of tumor extent. In parenthesis is the percentage of cases for the Gleason score group. Dotted lines represent trend lines fitted using a cubic equation. High-grade tumors showed a higher proportion of extensive tumors compared with tumors of lower Gleason score (P = .006).

