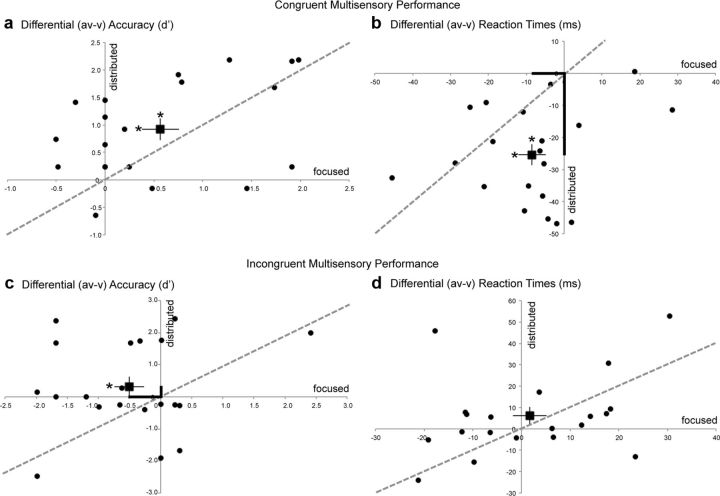
Figure 2.
Behavioral performance during distributed audiovisual attention relative to focused visual attention depicted as (AV − V) normalized measures for all participants (black circles). The square data point with error bars represents the sample mean and SEM. The unity line references equivalent performance across the two attention manipulations. Measures are shown as differential d′ (a, c) and differential RTs (b, d). Asterisks on the mean data points represent significant AV versus V performance differences (on horizontal error bars for focused attention and on vertical error bars for distributed attention). Bolded axial distances in b and c emphasize significant performance differences between the focused and distributed attention conditions. Note that distributed attention results in superior performance on congruent trials (RT) and incongruent trials (d′).

