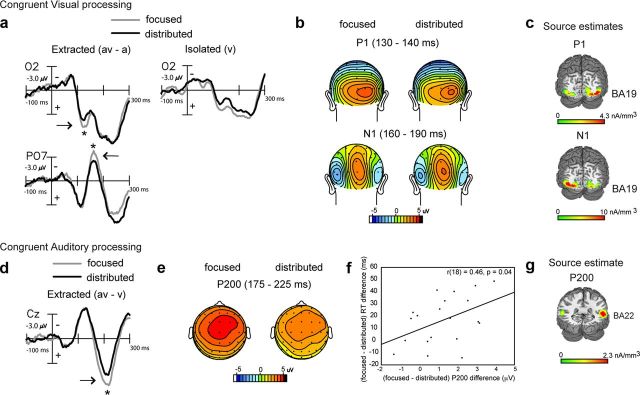
Figure 3.
Grand-averaged difference waves (n = 20) depicting multisensory processing during the congruent trials compared for the focused and distributed attention conditions. a, Extracted processing for the visual constituent of multisensory stimulation (AV − A) at occipital sites O2 and PO7 showing significant amplitude differences at 130–140 and 160–190 ms, with corresponding topographical maps in b and source estimates in c. Corresponding ERPs elicited to isolated visual targets are also shown in a for reference, to the right of the extracted difference waves. d, Extracted processing for the auditory constituent of multisensory stimulation (AV − V) showing attention-related differences at 175–225 ms latency (P200 component) at a medial central site (Cz; positive voltage plotted below horizontal axis). e, Topographical voltage maps corresponding to the P200 component difference. f, Positive neurobehavioral correlations between P200 modulation and RT differences across the two attention conditions. g, Current source estimates for the P200 component.

