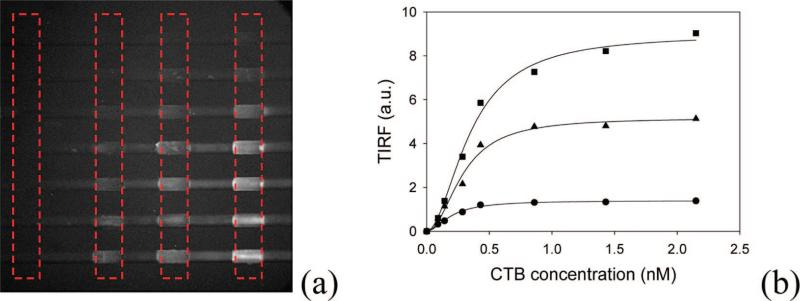
Figure 9.
(a) TIRF image of bilayer-arrayed microchannels containing various concentrations of dye-labeled CTB. The four sets of bilayer patches designated with the dashed red boxes represent identical membrane chemistries. From left to right, the bilayer patches contain 0.0, 0.2, 0.5, and 2.0 mol % GM1 in POPC, respectively. The long access of each channel is from left to right across the image. (b) TIRF signal vs bulk CTB concentration for each of the three GM1 concentrations: 2.0 (■), 0.5 (▲), and 0.2 mol % (●). The solid lines are fits to the data with eq 1.

