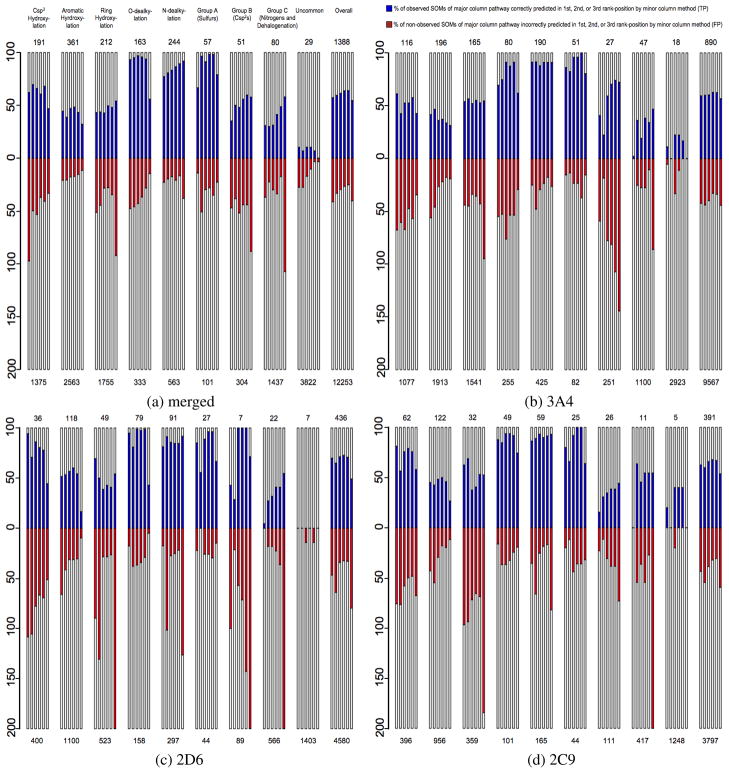
Figure 3.
True-positive (TP) and false-positive (FP) prediction rates of individual methods broken down by CYP-mediated pathway. Each major column represents a specific pathway set, identified at the top of 3a, that is composed of all SOMs from the given substrate set that have the potential to undergo that pathway. Similar pathways, or those with low relative populations, were grouped together as detailed in Table 6 (see Methods) to simplify overall presentation. Each pathway column is composed of multiple mini-columns that represent the number of predicted TPs/FPs by (from left to right) QC, TOP, TOP QC, TOP QC SCR, TOP SCR and SMARTCyp models for 3a and StarDrop, Schrödinger, TOP QC SCR, TOP SCR and SMARTCyp models for 3b, 3c, and 3d. SMARTCyp was not specifically calibrated for 2C9 or 2D6, but is a measure of the importance of reactivity for specific sets of substrates and isozymes. The y-column of each pathway column represents the percentage of observed SOMs from the given pathway of the given substrate set, with the actual number being shown at the top of each column. This scaling was chosen to ensure that visualization of true-negatives would not overshadow more interesting results. The number of potential (observed and non-observed) SOMs of each pathway for each substrate set is given at the bottom of each column.

