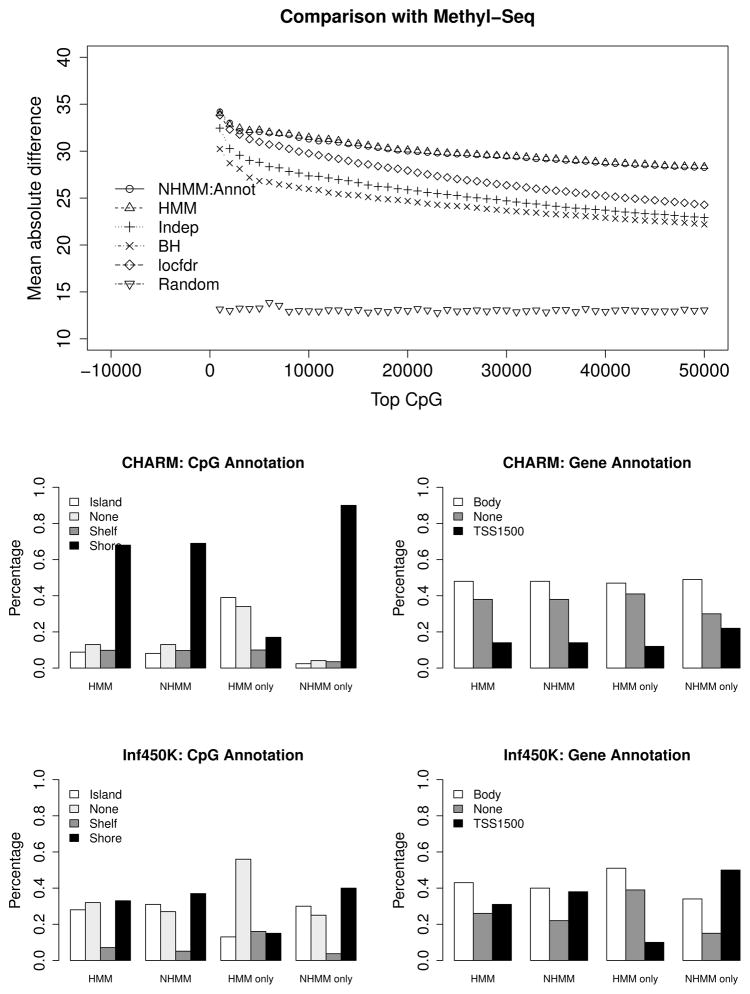
Figure 4.
Top panel compares the mean absolute differential methylation between tumor and normal in an independent Methyl-Seq data. Probes are ranked ordered within each method. Middle left (right) panel compares the CpG annotation (gene annotation) of the top 5% probes ranked by “HMM” and “NHMM: Annot” on the CHARM array. “HMM only” and “NHMM only” refer to the probes unique to “HMM” and “NHMM: Annot”, respectively. Bottom panels are similar to middle panels, which compares the results of the top 5% probes ranked by “HMM” and “NHMM: Dist+Annot” on the Infinium HumanMethylation450 BeadChip.

