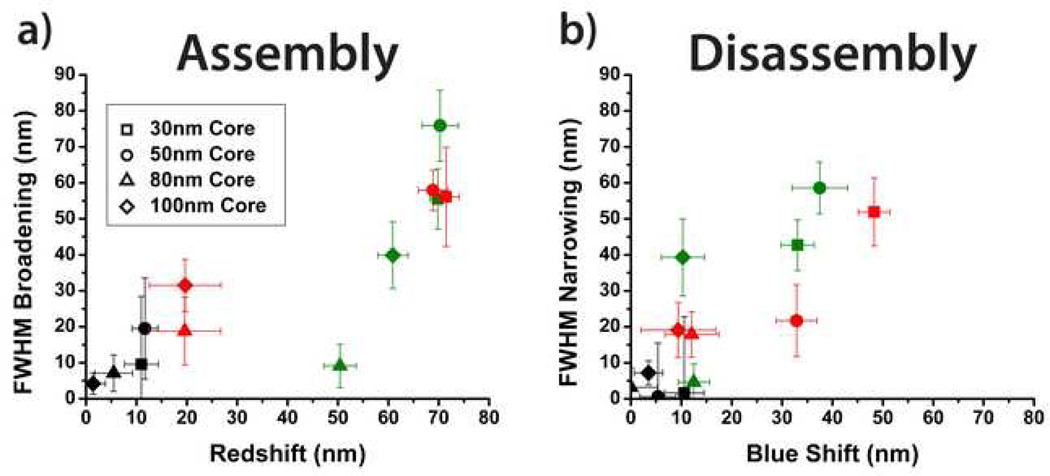
Figure 4.
Correlation between peak shift and FWHM broadening/narrowing upon a) assembly and b) disassembly. Data points are extracted from Figure 3 with the shape corresponding to the core size and the color corresponding to the satellite size. 10 nm, 30 nm, and 50 nm satellites are represented by black, green, and red, respectively.

