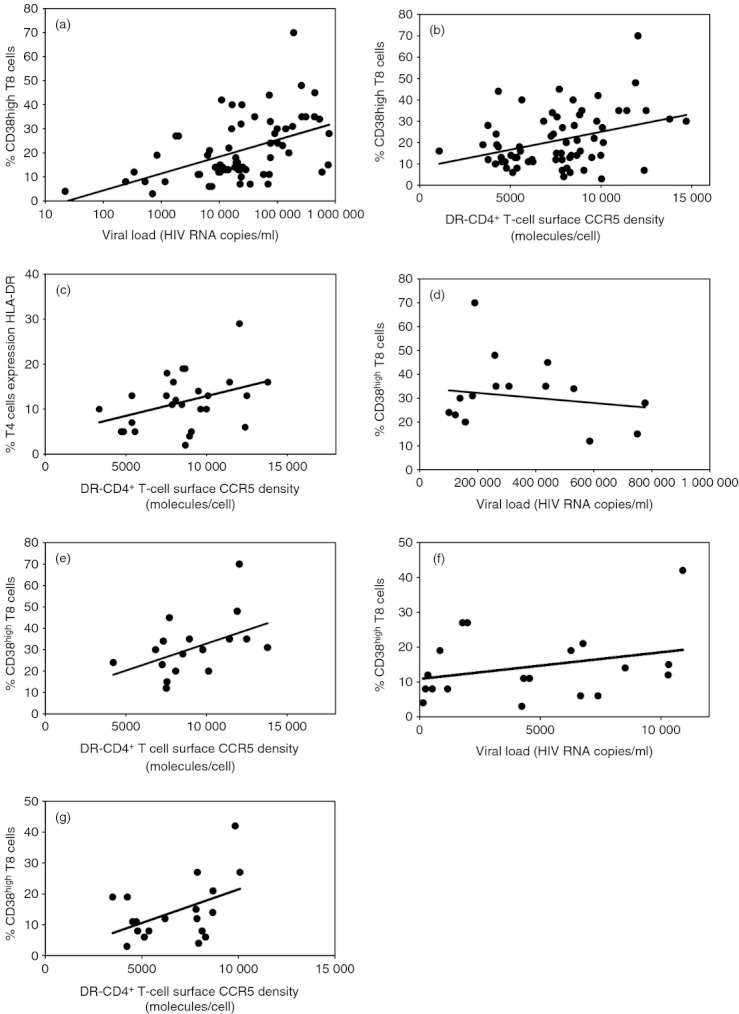
Figure 2.

Correlation between the percentage of CD38hi CD8+ T cells and HIV-1 RNA plasma level (a), and the mean number of CCR5 molecules at the surface of DR− CD4+ T cells (b), and between the percentage of DR+ CD4+ T cells and the mean number of CCR5 molecules at the surface of DR− CD4+ T cells (c) in non-treated patients with HIV-1 infection. Correlation between the percentage of CD38hi CD8+ T cells and HIV-1 RNA plasma level (d, f), and the mean number of CCR5 molecules at the surface of DR− CD4+ T cells (e, g) in patients who presented with viraemia over 100 000 (d, e) or below 10 000 (e, f) copies/ml.
