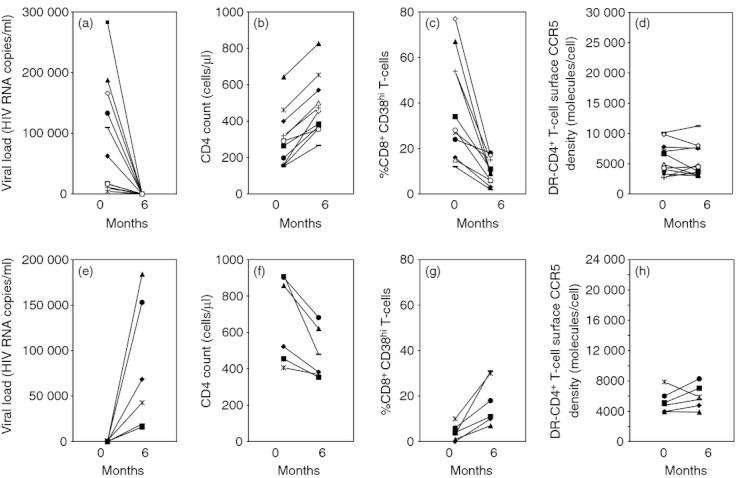
Figure 3.

Evolution of HIV-1 RNA plasma level (a), CD4 count (b), percentage of CD38hi CD8+ T cells (c), and CCR5 density at the surface of DR− CD4+ T cells (d) in HIV-1-infected patients before and after treatment with highly active anti-retroviral therapy (HAART). Months represent time from initiation of therapy. Evolution of HIV-1 RNA plasma level (e), CD4 count (f), percentage of CD38hi CD8+ T cells (g), and CCR5 density at the surface of DR− CD4+ T cells (h) in HIV-1-infected patients before and after interruption of highly active anti-retroviral therapy. Months represent time from cessation of therapy.
