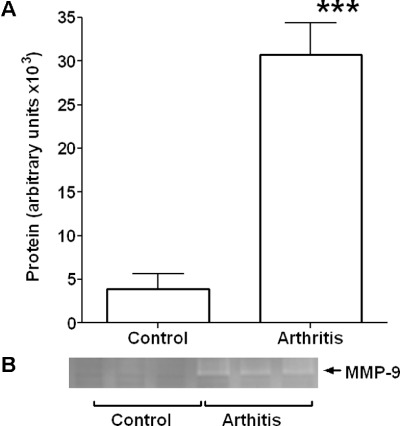
Figure 4.

Aortic MMP-9 activity. Graph showing densitometry data (A) and representative zymograph (B) for MMP-9 activity in homogenates of aorta from control animals and those with mild inflammatory arthritis. A significant increase was observed following the development of arthritis. ***P < 0.001 significantly different from control, n= 6 for all groups.
