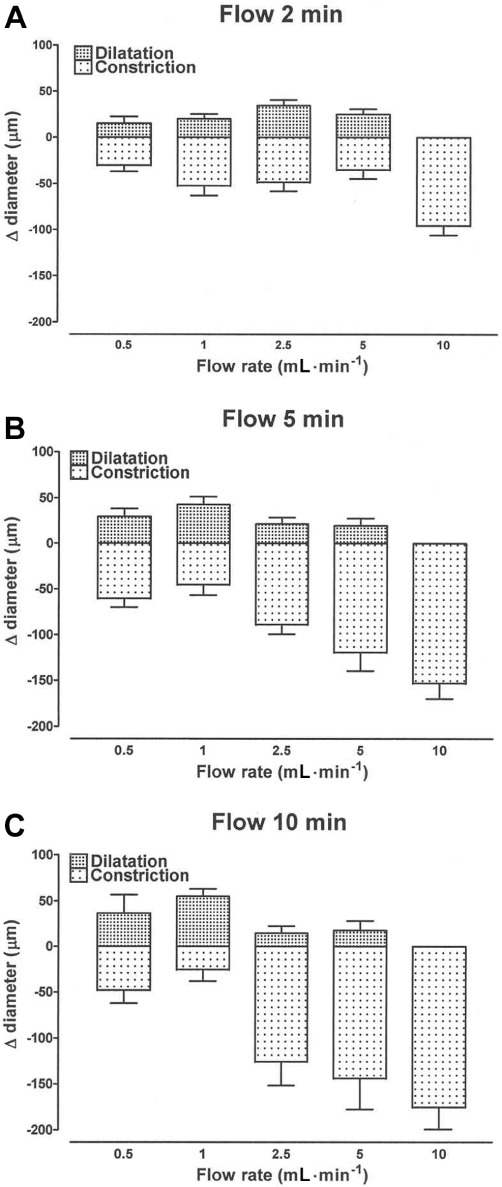
Figure 5.

Bar graphs showing how flow-induced dilatation and constriction varied with flow rate (0.5–10 mL·min−1) and with the duration of flow for 2 min (A), 5 min (B) and 10 min (C) in carotid artery segments at an intermediate level of U46619-induced tone. Data are presented as the mean ± SEM of 5–11 observations.
