
Figure 3.
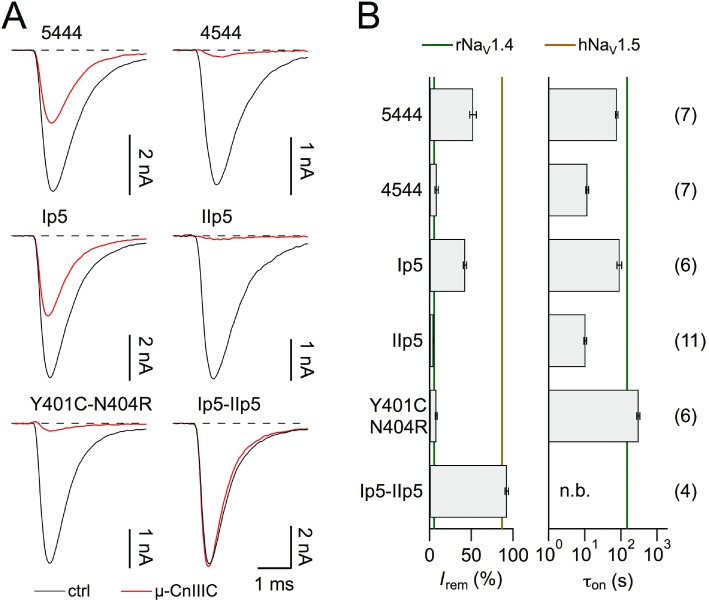
Chimeras between rNaV1.4 and hNaV1.5. (A) Superposition of current traces at −20 mV before (black) and after application of 1 µM µ-CnIIIC (red) for the indicated chimeras and the TTX-site mutant rNaV1.4-Y401C-N404R. (B) Mean remaining current (left) and apparent time constant of onset of block (right) for the indicated chimeras and mutants. Vertical lines indicate mean values for the respective wild-type channels. ‘n.b.’ refers to a situation where no onset was measured because channels were not blocked. The n values are shown in parentheses.