
Figure 4.
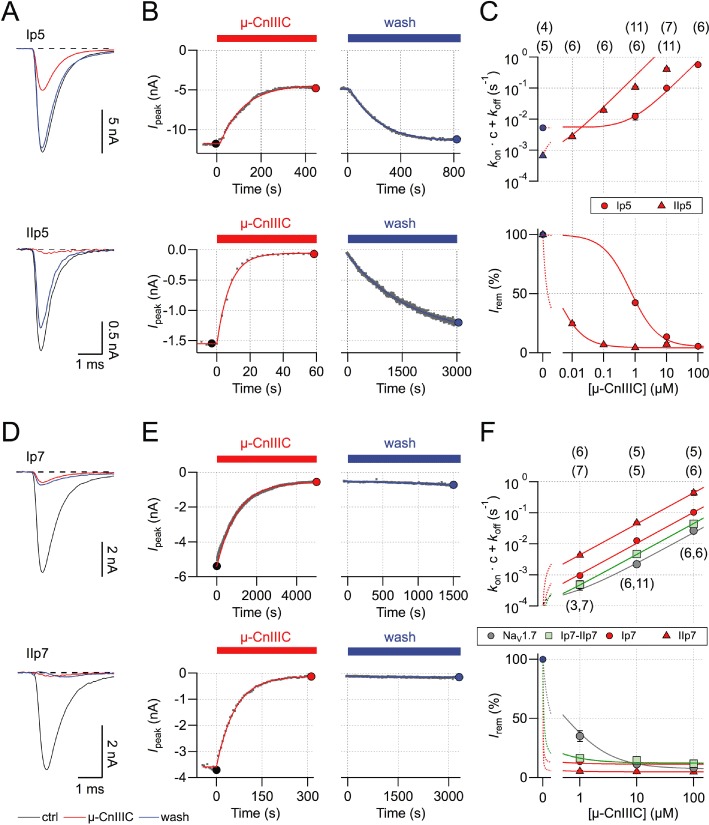
Analysis of pore-loop chimeras. (A) Superposition of current traces at −20 mV before (black) and after application of 1 µM µ-CnIIIC (red), as well as upon toxin washout (blue) for chimeras Ip5 (top) and IIp5 (bottom). (B) Time courses of toxin-induced current block and recovery kinetics upon wash with superimposed single-exponential fits. Solid symbols indicate data points from current traces shown in (A). (C) Kinetic analysis based on steady-state block and kinetics measured for various µ-CnIIIC concentrations. Lines are global data fits according to equations 1–2 for Ip5 (circles) and IIp5 (triangles). The n values are shown in parentheses. (D–F) Similar experiments as in (A–C) but for chimeras Ip7, IIp7 and Ip7-IIp7. The grey symbols in (F) indicate data for wild-type hNaV1.7.