
Figure 5.
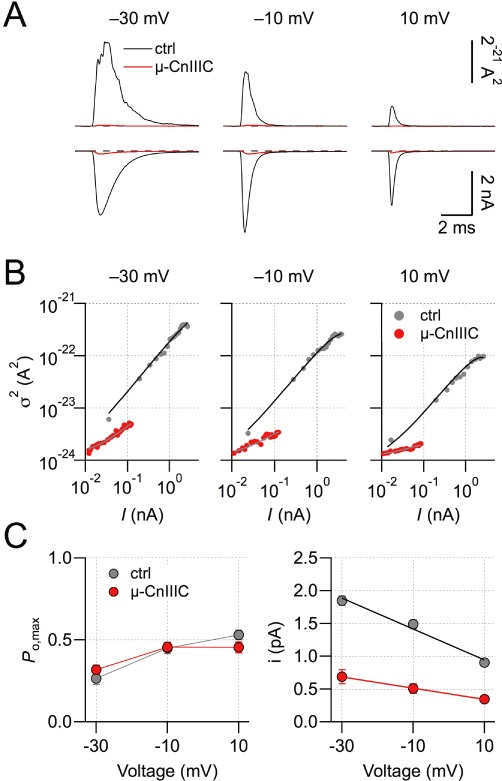
Single-channel characteristics. (A) Mean current and ensemble variance of rNaV1.4 channels at the indicated voltages based on 200 individual current recordings before (black) and after application of 10 µM µ-CnIIIC (red). (B) Ensemble variance as a function of mean current for the indicated voltages without and with toxin. Continuous lines are fits according to equation 3. (C) Voltage-dependence of the maximal open probability and the single-channel current amplitude derived from non-stationary noise analysis. Lines connect the data points in the left panel; straight lines in the right panel are linear fits for determination of the chord conductance; n= 7.