
Figure 6.
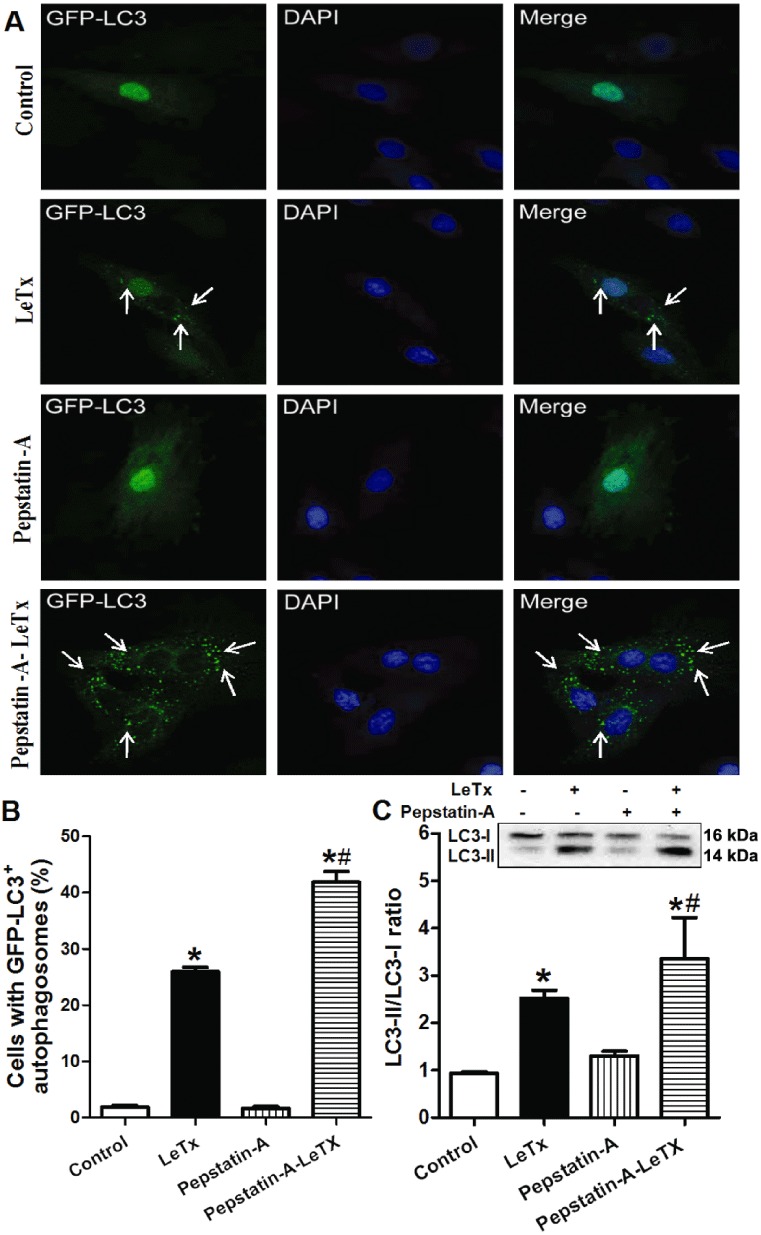
LeTx (100 ng·mL−1 for 3 h)-induced autophagy in H9C2 cells in the absence or presence of the lysosomal inhibitor pepstatin-A. (A) Representative microscopic images of GFP-LC3II (puncta shown in arrowheads). (B) Quantitation of cells with autophagosomes. (C) LC3-II/LC3-I ratio. Inset: Representative gel blots depicting expression of LC3 and GAPDH (loading control). Mean ± SEM, n= 3 independent cultures, *P < 0.05 versus control group, #P < 0.05 versus LeTx group.