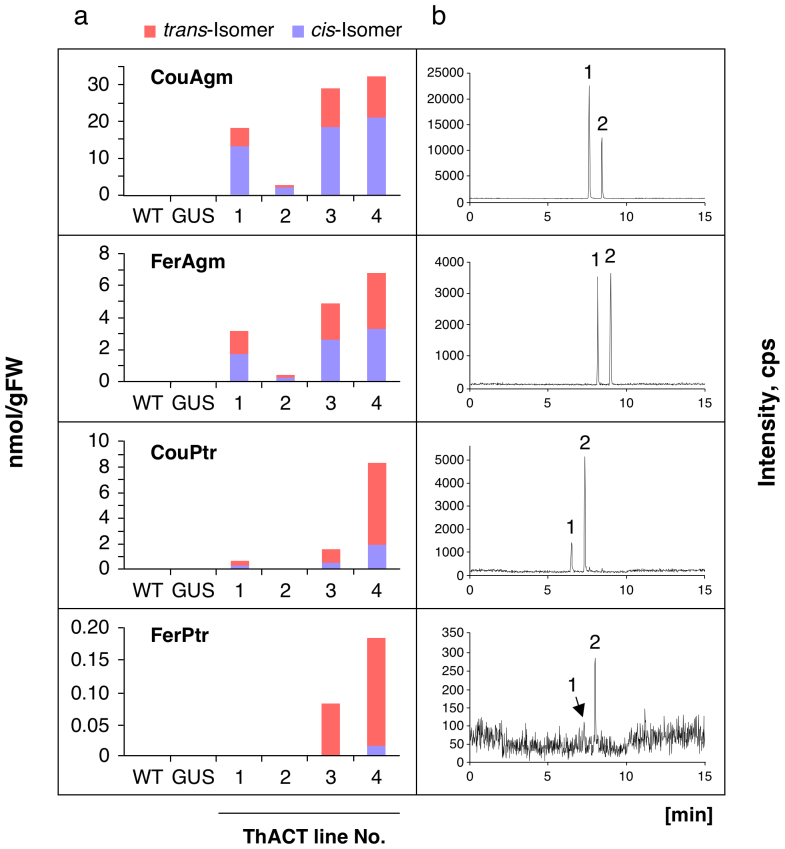
Figure 2. Accumulation of HCAAs in the leaves of wild-type (WT), GUS-transgenic control and ThACT plants.
(a) Means of trans- and cis-isomers of HCAA products in leaves (n = 4). (b) Representative HPLC-MS/MS profiles of HCAAs. Peaks 1 and 2 correspond to trans- and cis-isomers. The monitored mass transitions (Q1/Q3) were m/z 277.2/147.2 for CouAgm, 307.2/177.2 for FerAgm, 235.2/147.2 for CouPtr, and 265.2/177.2 for FerPtr.

