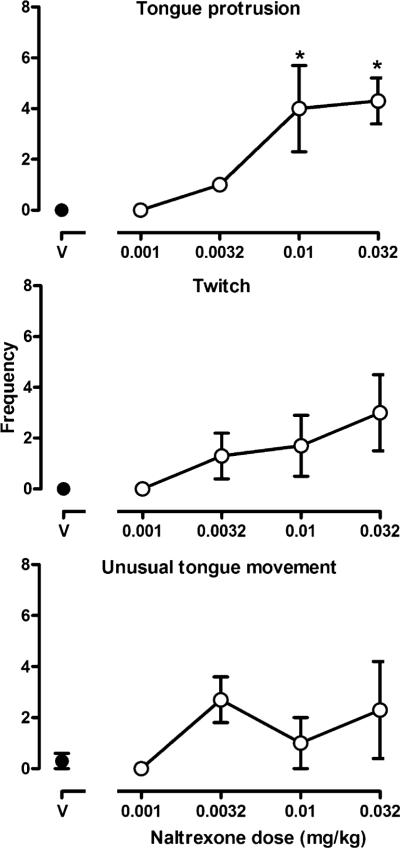
Fig. 2.
Selected behaviors observed every 15 s during a 2-min observation period. This occurred 30 min after the administration of vehicle (V) or naltrexone. Each data point represents the average (±SEM) number of times that a sign was observed (maximum possible score=8). One-factor repeated-measures ANOVA was followed by Dunnett's test to determine which points were significantly (*p<0.05) different from control (points above V). Ordinate: frequency of signs. See Fig. 1 for other details

