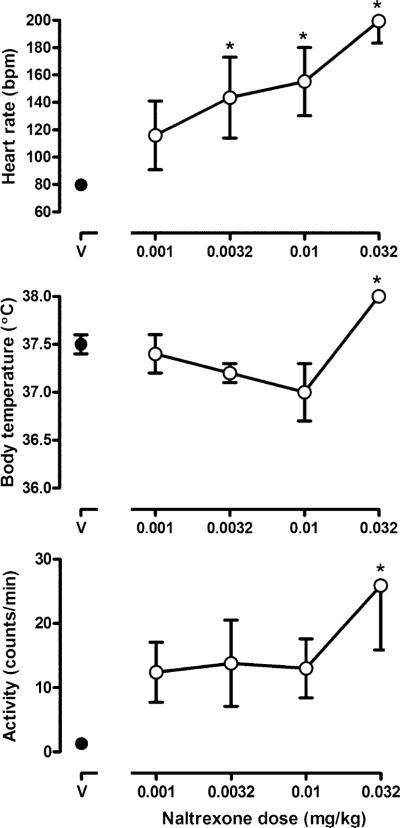
Fig. 3.
Heart rate (upper panel), body temperature (middle panel), and activity (bottom panel) after administration of vehicle (V) or naltrexone. Each symbol represents the average (±SEM) values for heart rate and body temperature at the time of the peak effect (20 min after injection) and for activity (40 min after injection). Two-factor repeated-measures ANOVA was followed by Dunnett's test to determine which points were significantly (*p<0.05) different from control (points above V). Ordinate: upper heart rate (beats per minute); middle body temperature (°C); bottom activity (counts per minute). See Fig. 1 for other details

