
Figure 2.
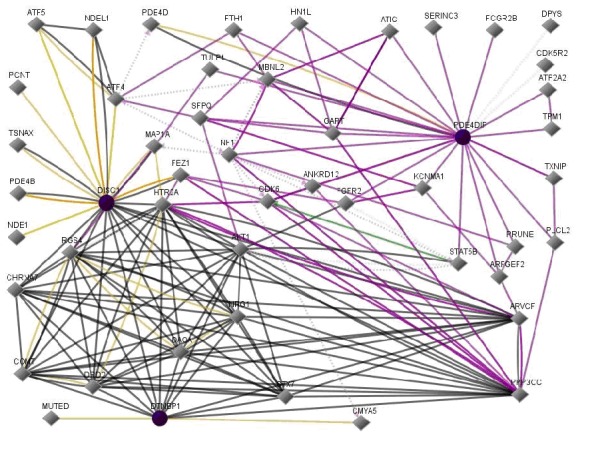
DISC1, DTNBP1, and PDE4DIPinteractions. In this figure, line-colors and various interactions with other genes are red Down-regulation, green Up-regulation, beige Regulation, purple Co-expression, brown Physical Interaction, turquoise dotted Predicted Protein Interaction, and mauve dotted Predicted TFactor Regulation. (GenePro SA Biosciences, http://www.sabiosciences.com/).