
Figure 1.
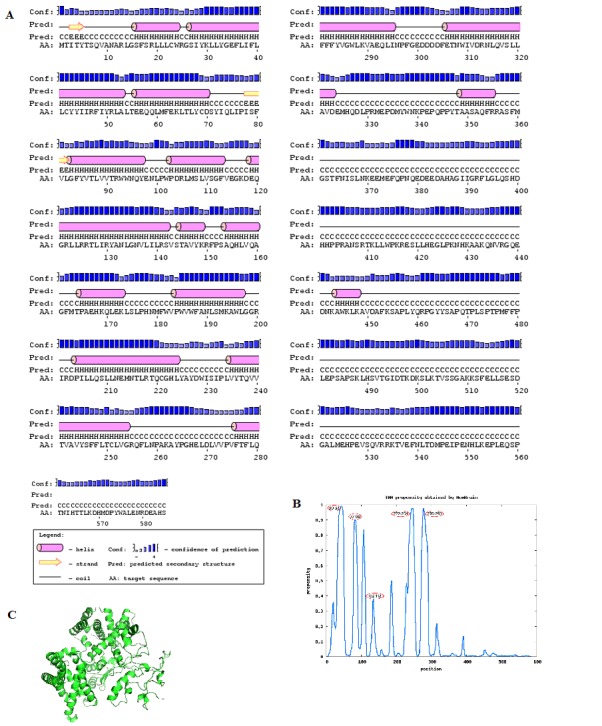
(A) Secondary structure prediction of hbest1 sequence using PSI-PRED server; (B) Graph representing propensities of TM helices. Numbers circled in red are the positions of TM helices; (C) Robetta modeled structure of hbest1
Official websites use .gov
A
.gov website belongs to an official
government organization in the United States.
Secure .gov websites use HTTPS
A lock (
) or https:// means you've safely
connected to the .gov website. Share sensitive
information only on official, secure websites.
(A) Secondary structure prediction of hbest1 sequence using PSI-PRED server; (B) Graph representing propensities of TM helices. Numbers circled in red are the positions of TM helices; (C) Robetta modeled structure of hbest1