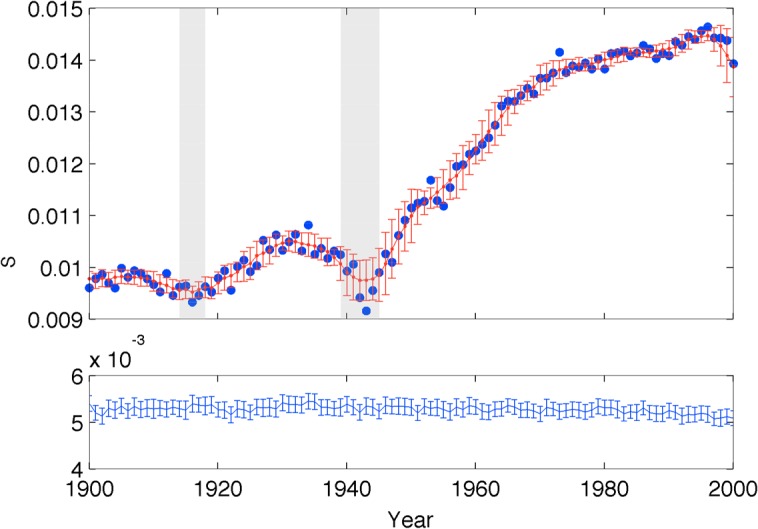
Figure 3.

Evolution of introspection in the modern cultural record. Top: the blue circles correspond to semantic relatedness to introspection, and the red trace to the mean and standard deviation of these values on a 6-year running window (i.e., running average and nosie). The gray shades correspond to the two World Wars, and the red vertical dashes the standard deviation of the null hypothesis. Bottom: mean and standard deviation of the null hypothesis corresponding to randomized word frequencies.
