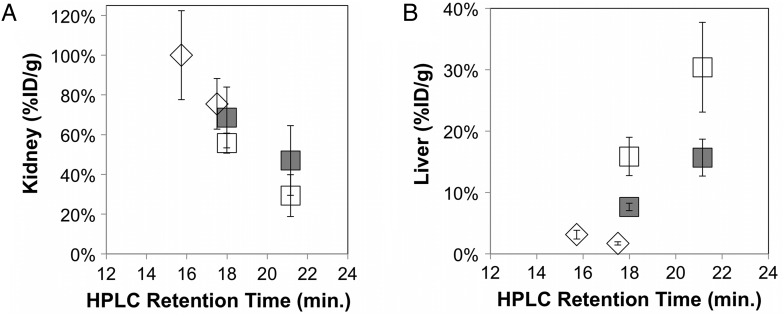
Fig. 4.
Impact of hydrophilicity on renal and hepatic signal. nu/nu mice were injected with 64Cu-fibronectin domain via the tail vein. Five-minute static scans were acquired. Signals in the (A) kidney and (B) liver were quantified with AsiProVM. Value and error bars represent mean and standard deviation (n = 3–5). A′ and A-phil (open squares), non-binding scrambled mutants (filled squares), and D′ and D-phil (diamonds).

