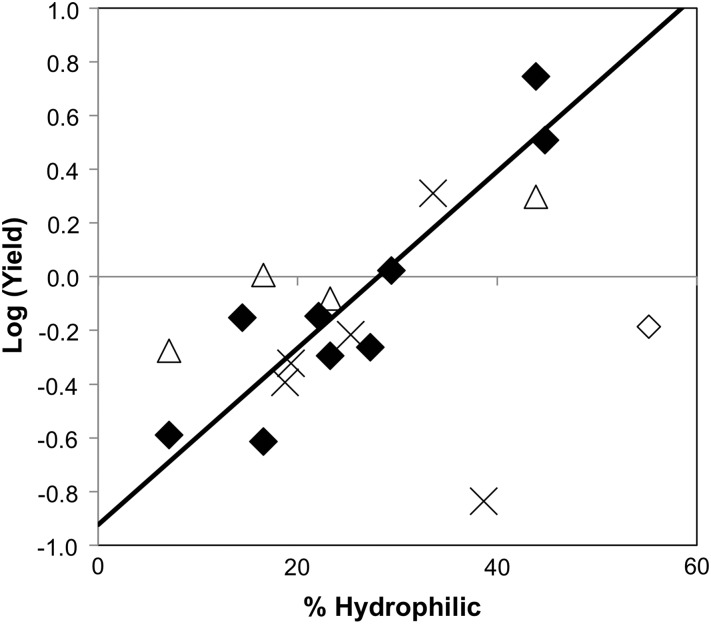
Fig. 6.
Relation of yield to phylogenetic frequency of hydrophilic residues. The logarithm of the yield of a mutant relative to the yield of A′ is plotted on the ordinate. The phylogenetic frequency of hydrophilic amide or hydroxyl residues (N, Q, S, T or Y) at the site of that mutation is plotted on the abscissa. The best-fit linear correlation is shown for 9 of the 10 hydrophobic sites mutated to their most phylogenetically frequent hydrophilic residue (closed diamonds); the outlier, V11T, is also shown (open diamond). Four secondary mutants whose primary mutant had low yield or low hydrophilic shift are shown (open triangles). Five mutants from mid-hydrophilic side chains to amides are shown with their phylogenetically amide frequency only (cross).

