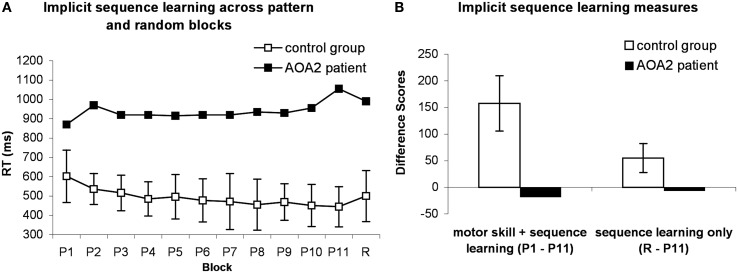
Figure 1.
The performance of the patient and controls on the SRT task. (A) Means of median RTs are displayed for control group (open squares) and median RTs for the patient (filled squares). (B) Difference scores of overall skill learning (P1-P11) and sequence learning (R-P11) are displayed. Error bars indicate standard deviations, computed for control group only. P, pattern; R, random.

