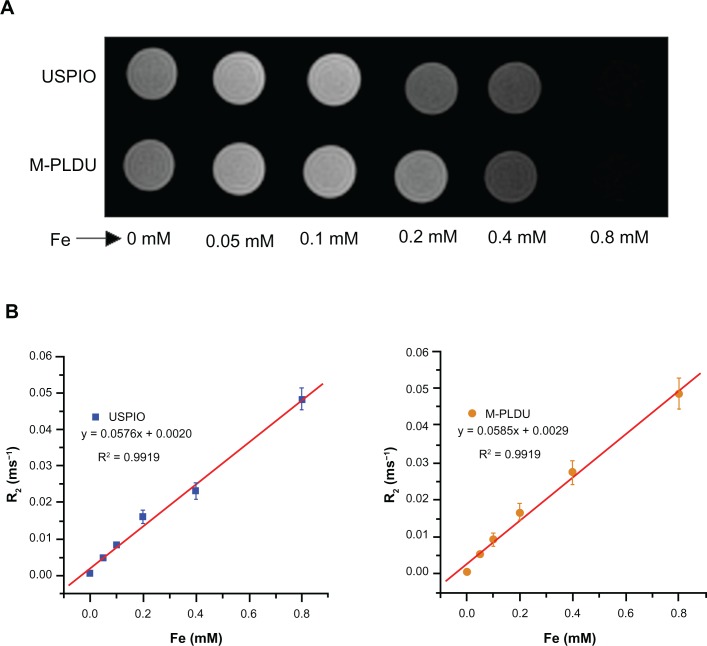
Figure 3.
MRI properties of USPIOs and M-PLDUs in vitro: (A) signal intensity T2-weighted images (TR = 2500 ms; TE = 36 ms) of USPIOs and M-PLDUs in PBS at various iron concentrations at 25°C; blank PBS was taken as a control; (B) T2 relaxation rate (R2) of USPIOs and M-PLDUs vs iron concentration.
Note: Data as values obtained from curve fitting.
Abbreviations: MRI, magnetic resonance imaging; USPIOs, ultrasmall superparamagnetic iron oxides.

