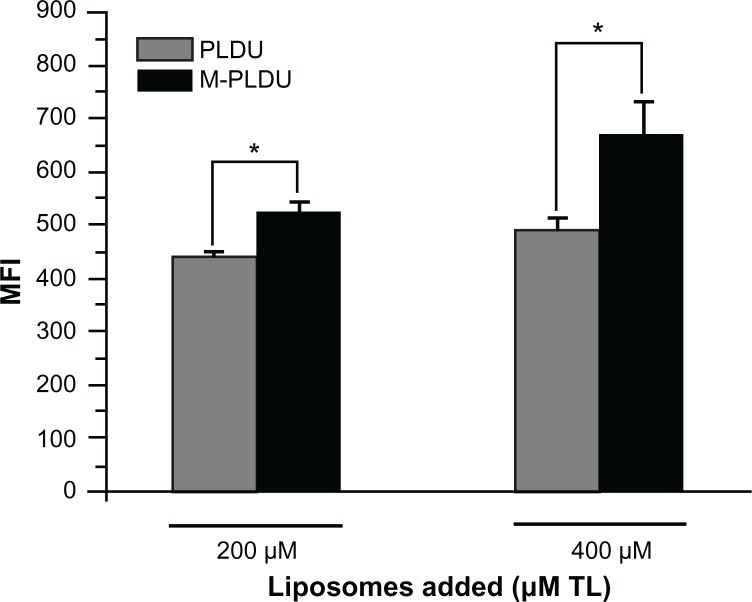
Figure 6.
Quantification of liposomal formulations transported within Panc-1 cells.
Notes: Panc-1 cells were seeded in 48-well plates at a density of 1 × 10⁵ cells per well for 24 hours. Then M-PLDUs or PLDUs labeled with CFPE were incubated with the cells for another 24 hours at 37°C (final total lipid concentration was 200 μM or 400 μM). The cells were trypsinized and washed twice with PBS, and finally MFI was analyzed by FCM. Each point represents the mean ± SD (n = 3, *P < 0.05).
Abbreviations: FCM, flow cytometer; MFI, mean fluorescence intensity.

