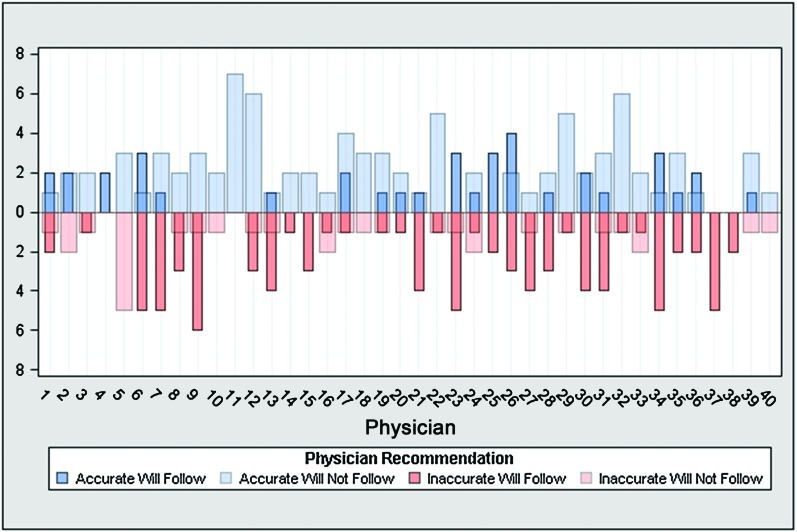
Figure 2.
Distribution of the number of accurate or inaccurate outcome expectations by physician; accurate counts are denoted in the up direction (blue) and inaccurate counts are denoted in the down direction (red). Physicians can be accurate or inaccurate about a patient following or not following recommendation; blue indicates accurate predictions for following recommendations (darker blue) or not following predictions (light blue); red indicates inaccurate predictions for following recommendations (darker red) or not follow recommendations (light red). A colour version of this image is available in Family Practice online.

