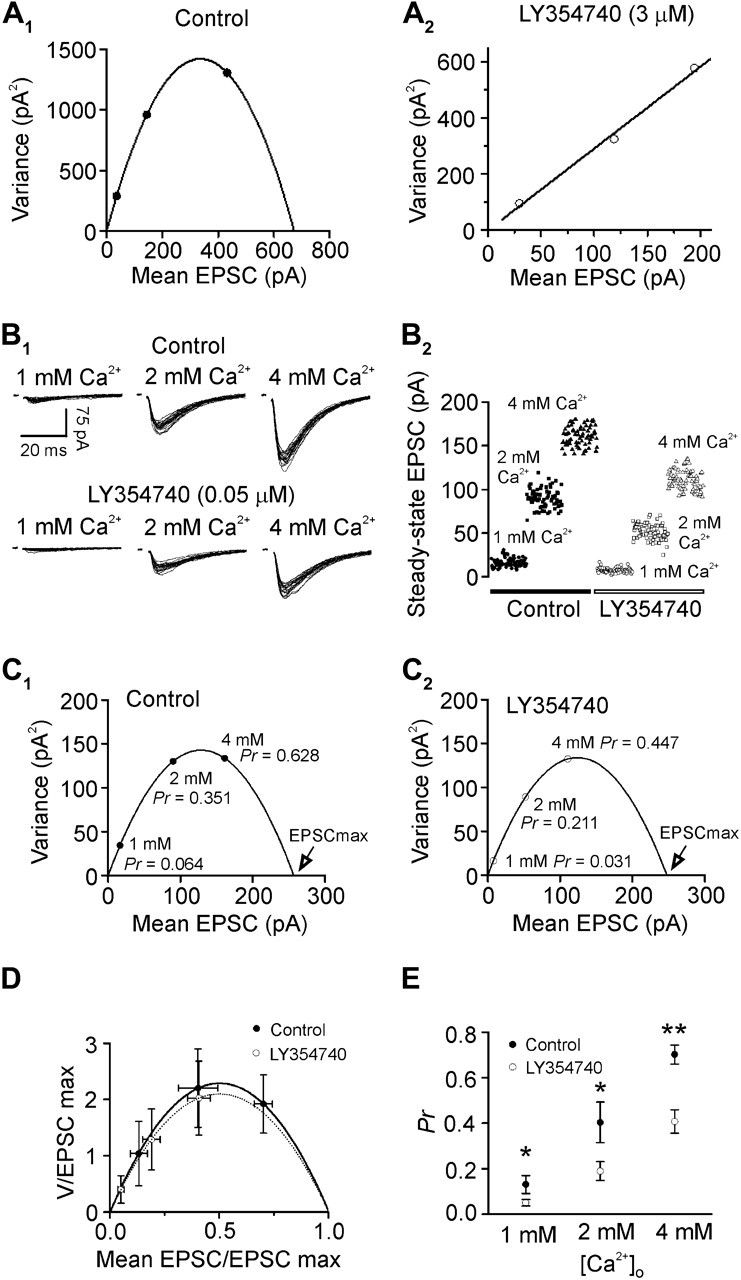
Figure 4.

V–M analysis shows that mGluR II–mediated inhibition of glutamate release is associated with a reduction of Pr without effects on q and N. (A1) V–M plot for a layer III pyramidal neuron in control condition showed a parabolic relationship. (A2) V–M plot for the same layer III pyramidal neuron in A1 after application of LY354740 (3 μM) showed a linear relationship. (B1) Superimposed evoked EPSCs recorded at 1, 2, and 4 mM [Ca2+]o before (upper panel) and after (lower panel) the application of LY354740 (0.05 μM). (B2) Scatter plot of the EPSC peak amplitudes recorded at 1, 2, and 4 mM [Ca2+]o before (filled symbols) and after (open symbols) LY354740. (C1) V–M plot in control condition. Pr was calculated as the ratio of the mean EPSC amplitude at each concentration divided by the EPSCmax obtained by fitting the parabolic relationship. (C2) V–M plot after the application of LY354740 (0.05 μM) at the same synapse. Note that the Pr was reduced at each concentration of Ca2+ after application of LY354740 compared with control. (D) V and M values from each neuron were normalized by dividing each value by the predicted EPSCmax. Normalized curves were similar before and after the application of LY354740 indicating that q and N were not significantly changed by LY354740. (E) Pr values derived from the parabolic fits at different Ca2+ concentrations before and after LY354740. Note that LY354740 significantly attenuated Pr at each Ca2+ concentration (*P < 0.05; **P < 0.01).
