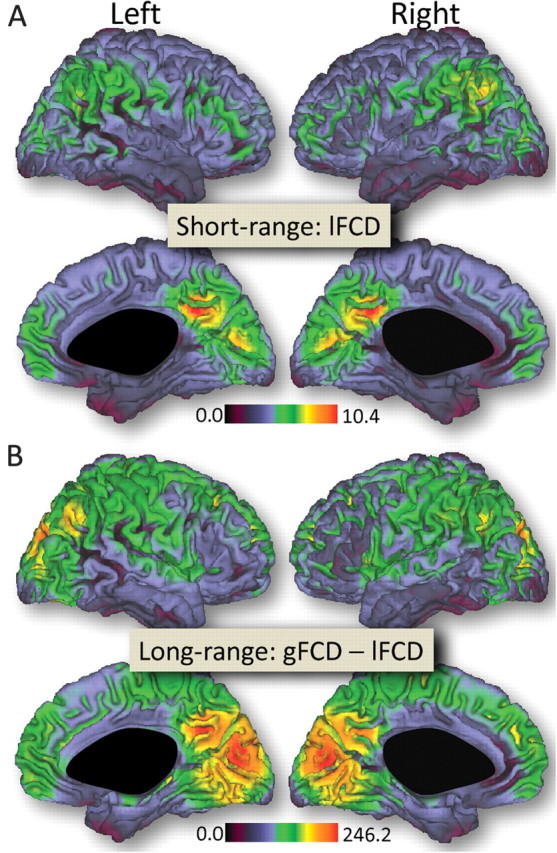
Figure 1.

Surface rendering showing the distribution of short-range (A) and long-range (B) FCD in the human brain. Sample: all 913 subjects included. Threshold used to compute short- and long-range FCD: R > 0.6. The images were created using the Computerized Anatomical Reconstruction and Editing Toolkit (CARET) 5.0, which is freeware software developed at Washington University (http://brainvis.wustl.edu/wiki/index.php/Caret:About).
