
Figure 4.
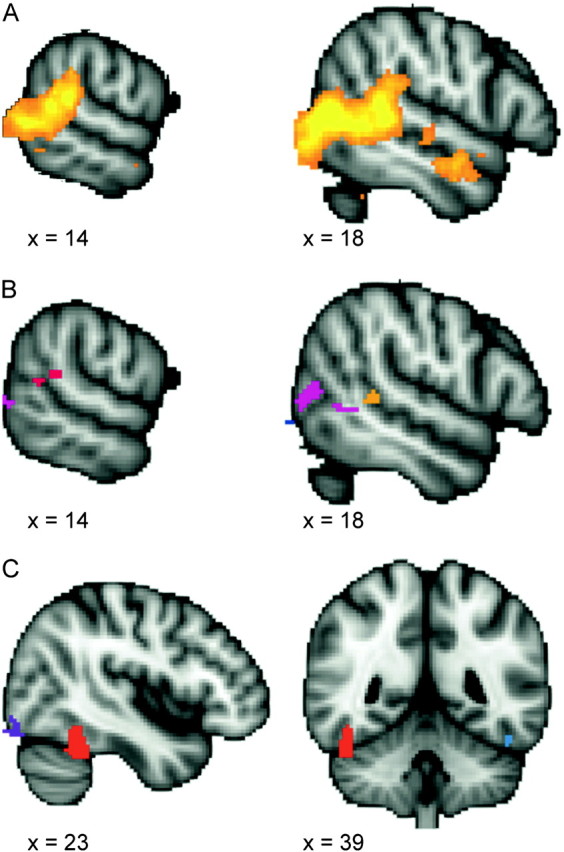
Activation maps from localizer tasks. The top panel (A) shows the cluster-corrected contrast for the biological motion localizer task (biological > scrambled motion contrast). The color ranges from z = 2.3 (dark red) to 4.2 (bright yellow). Panel (B) shows the voxel-corrected contrast for the biological motion localizer task (biological > scrambled motion contrast). Two regions in the right STS were identified: a cluster within the posterior continuation and ascending limb of the STS (shown in red) and a cluster anterior to the crux of the STS (shown in orange). Panel (C) shows the uncorrected activation map from the face localizer task (face > scene contrast), thresholded at z = 2.57. The right FFA, used in subsequent ROI analyses, is shown in red.