
Figure 2.
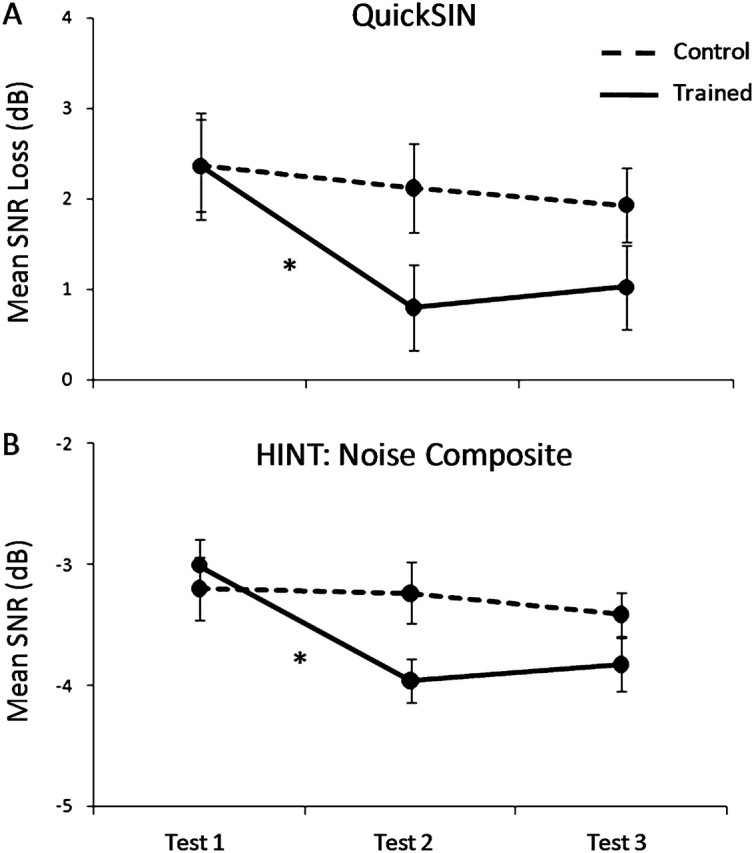
Mean speech-in-noise performance scores obtained from Tests 1, 2, and 3. Error bars represent one standard error of the mean (SEM). *P < 0.05. (A) Average QuickSIN SNR loss scores of the trained (solid) and control (dashed) groups from each test session. Trained subjects showed a significant improvement after training (t27 = 5.025, P < 0.001) on this task. (B) Average HINT Noise Composite SNR values of trained (solid) and control (dashed) groups from each test session. Trained subjects showed significant improvements after training in the Noise-Front, -Right, and Composite conditions (t27 = −3.586, −4.280, −5.092; and P = 0.001, <0.001, <0.001, respectively). The HINT-Left condition showed a marginal change (t27 = −1.926, P = 0.065).