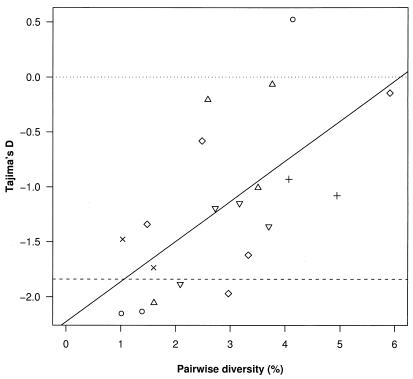
Figure 3.
Estimates of Tajima's D against pairwise diversity for viruses sequenced from each pulp. The dashed line indicates significantly (P, approximately less than 0.05) negative values of D (<1.84), whereas the dotted line indicates D = 0 (the expected value under a constant population evolving neutrally). Data from different individuals are represented by different symbols (see Fig. 2 legend). There is a significant (P < 0.001) correlation between Tajima's D and pairwise diversity.

