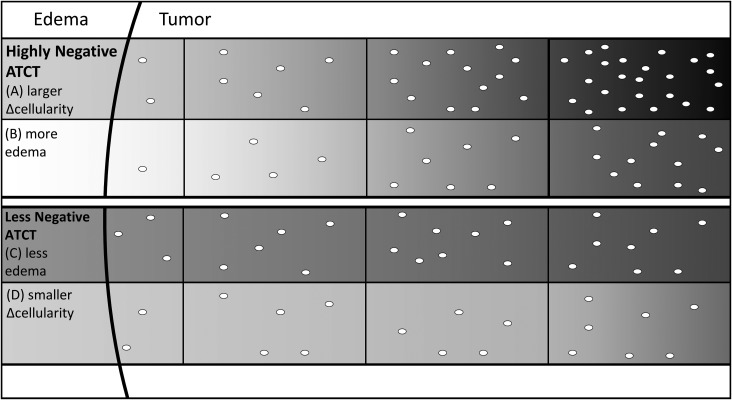
Fig. 5.
Visualizing the ATCT. The image visualizes the hypothetical difference between a highly negative value of ATCT (A and B) and a less negative value of ATCT (C and D). A highly negative value of ATCT means that there is an increased change in ADC from the first voxel on the edema-tumor boundary toward the tumor core. We believe this is related to either a larger change in cellularity from the first voxel toward the tumor core (A) or due to increased edema in the first voxel (B). The increasingly darker shades of grey represent the decreasing values of ADC as tumor cellularity inside the corresponding voxel increases. Conversely, the less negative value of ATCT could be due to less edema being present (C) or due to a smaller change in cellularity from the first voxel towards the tumor core (D).

