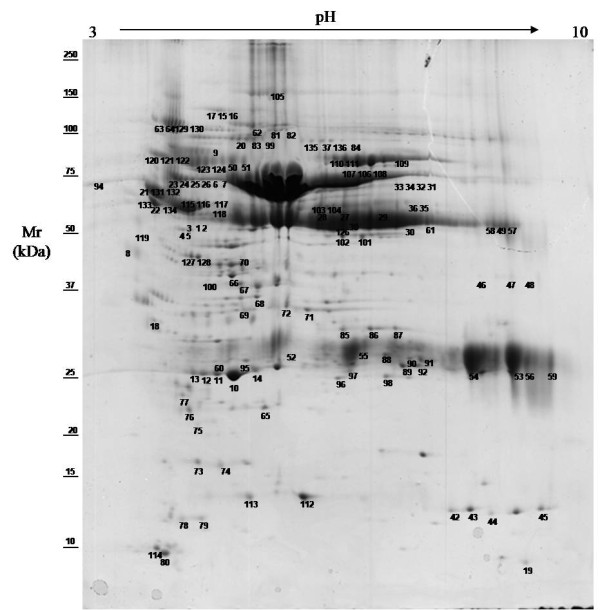
Figure 1.

2-DE reference map of sheep serum pH 3–10.Representative 2-DE map of sheep serum obtained by performing the first dimension (IEF) on IPG strips pH 3–10 and the second dimension on 9 –16 % gradient SDS-PAGE gels. The protein spots were visualized by Coomassie blue staining. The indicated spots were excised from gel and identified by MALDI-TOF MS and MS/MS. The results of MS identification are reported in Table 1. Mr standard values are indicated on the left.
