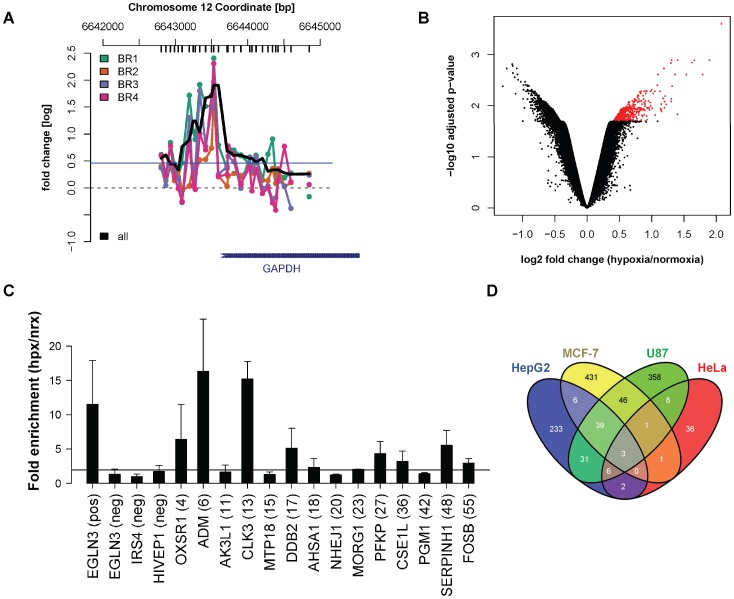
Figure 2. Comparative analysis of HIF1A ChIP-chip data in cell lines of different tissue origin.
(A) Visualization of HIF1A ChIP-chip readouts for the GAPDH promoter region in HeLa cells. The plot represents normalized intensities (log fold change hypoxia/normoxia, vertical axis) along the hg19 genomic coordinate (horizontal axis). Vertical black bars (top of the graph) mark the center position of array probes. The signal of four independent biological replicates is indicated in different colors (BR1 to 4). The smoothed black line corresponds to the averaged signal across replicates. The horizontal blue line indicates the intensity threshold for bound probes. (B) Volcano plot of HeLa ChIP-chip data (linear model across the four biological replicates). Spots in the plot correspond to individual probes in the array. Probes significantly enriched in hypoxic samples (p<0.02, FDR) are highlighted as red spots. (C) Quantitative PCR validation of HeLa ChIP-chip candidates. The official Gene Symbol corresponding to each region is indicated in the horizontal axis. Four control regions (one positive and three negative) were used as reference to estimate the successful validation of the indicated ChIP-chip candidates (candidate ranks in parenthesis). Bars represent the average fold enrichment in hypoxic versus normoxic ChIP samples (vertical axis), as obtained in three independent experiments. Error bars represent the standard deviation. The horizontal black line indicates the threshold for successful validation (90% confidence interval). (D) 4-way Venn diagram indicating the overlap of HIF1A bound regions as reported by ChIP-chip studies in hepatoma (HepG2 cells, ref. 9), mammary gland (MCF-7 cells, ref. 10), glioma (U87 cells, ref. 11) and cervix (HeLa cells, this study) origin.

