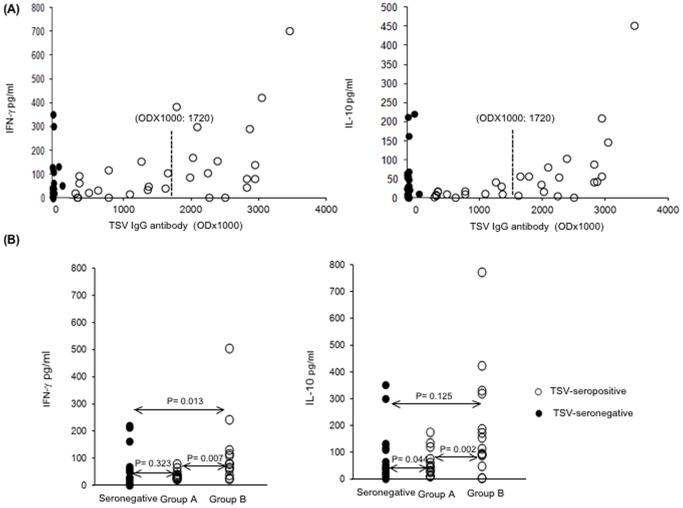
Figure 5. (A) Effect of TSV-specific IgG level on Th-cell responses.
TSV-specific IFN-γ and IL-10 responses were plotted against TSV-IgG among seropositive (open circles) and seronegative individuals (closed circles). TSV VP1 specific humoral immune response is shown by optical density × 1000 (OD×1000). Median OD×1000 (1720) is shown by (–) a line. (B) TSV-specific IFN-γ and IL-10 responses were compared between the TSV- seronegative subjects and sub-groups of TSV-seropositive subjects. Group A: TSV-seropositive subjects having TSV-IgG OD×1000 below 1720, and group B: subjects having TSV-IgG OD×1000 above 1720.

