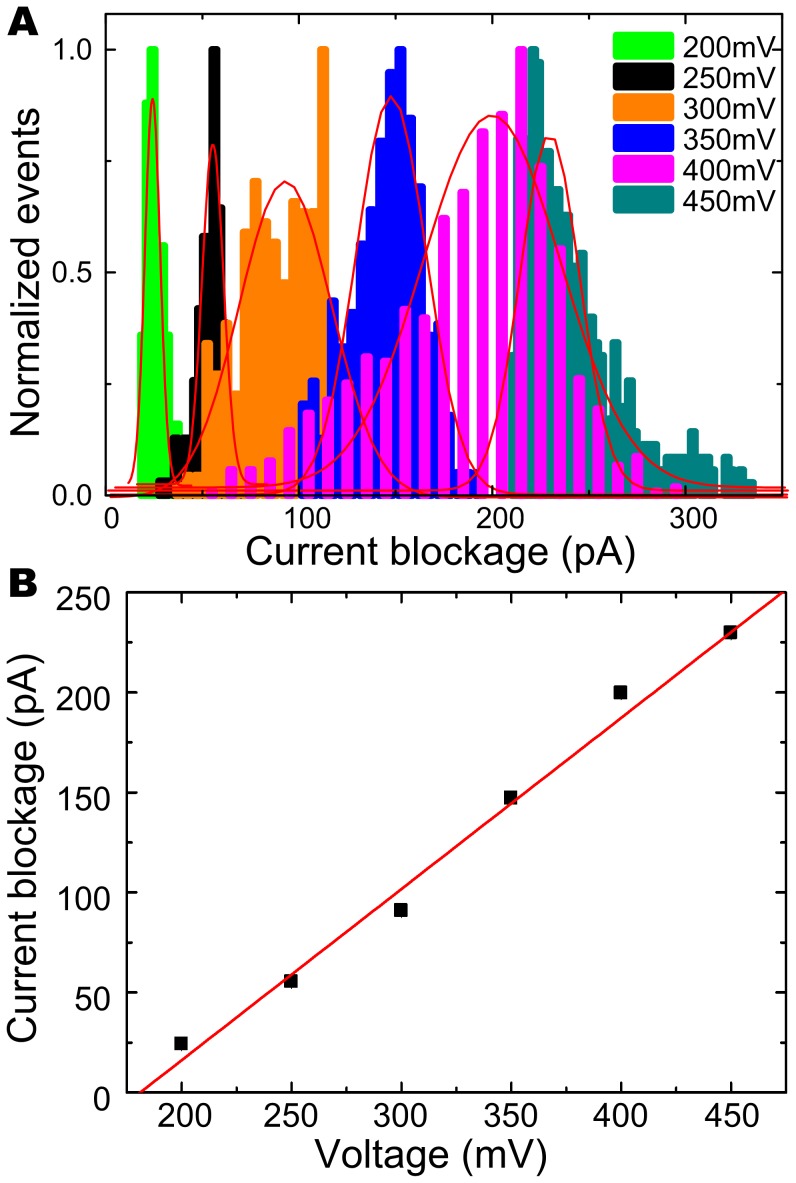
Figure 3. Current blockage histograms as a function of applied voltage.
A: For comparison all histograms are normalized as shown in the picture, by fitting all the histograms with Gaussian, a increase of the means of the histograms as a function of voltage can be clearly visualized. B: The plot of the means of the Gaussian fits of the current blockage histograms as a function of voltage, which is fitted by a line, with a slope of ∼0.85 pA/V and a intercept of 181 mV at voltage axis. It indicates that the current blockage increases with the applied voltage, and a threshold voltage of 181 mV.

