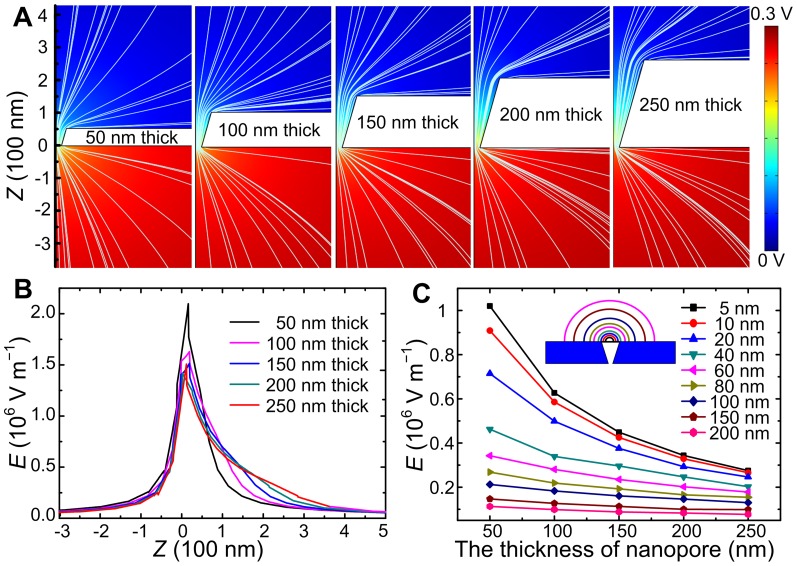
Figure 5. The simulations of the electric field as a function of the conical pore thickness. A:
Color coded potential distribution and electric field lines (white) of 50 nm, 100 nm, 150 nm, 200 nm, 250 nm thick conical nanopores with a same tip pore size (30 nm) and sidewall angle (73°), where the applied voltage is 300 mV. For a better comparison, all the Z at the tip pore center are set as 0. B: The electric field strengths ( ) of the five pores as a function of Z (−300 nm–500 nm). C: The electric field strengths (
 ) at a set of distances from the base pore as a function of pore thickness. The inset is a schematic illustration of the nine distances from the pore.

