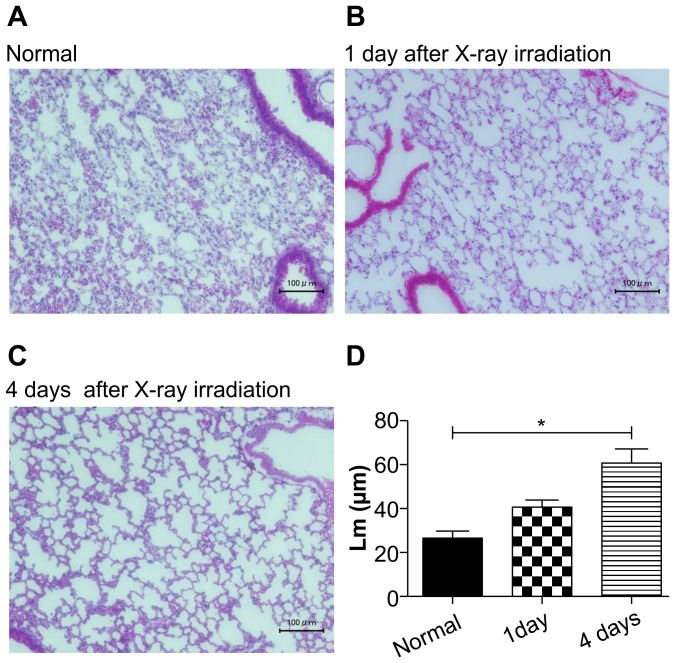
Figure 3. H & E stained histological sections of mouse lungs.
Representative images of H & E stained sections of (A) normal; (B) X1, 1 day after radiation exposure; (C) X4, 4 days after radiation lungs. Scale bars represent 100 µm. (D) Comparison of mean air space (Lm values) between groups. The mean air spaces (Lm) in irradiated lungs, one and four days following irradiation, were greater than in control lungs. A significant increase was also observed between lungs four days following x-ray exposure (*; P<0.001).

