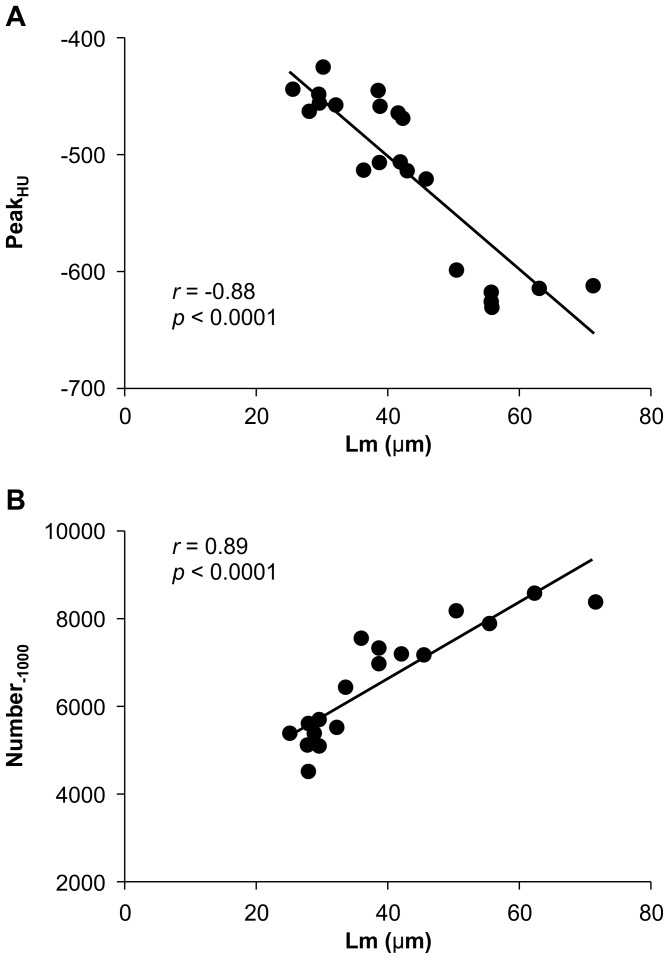
Figure 4. Correlation between micro-CT and histopathological data.
(A) Correlation between PeakHU (position of the peak between −200 to −800 HU) and LM (air space, determined from H & E stained coronal lung sections); (B) Correlation between the number of pixels at −1000 HU (Number-1000) and Lm. Results of correlation analyses (r and P values) are shown.

