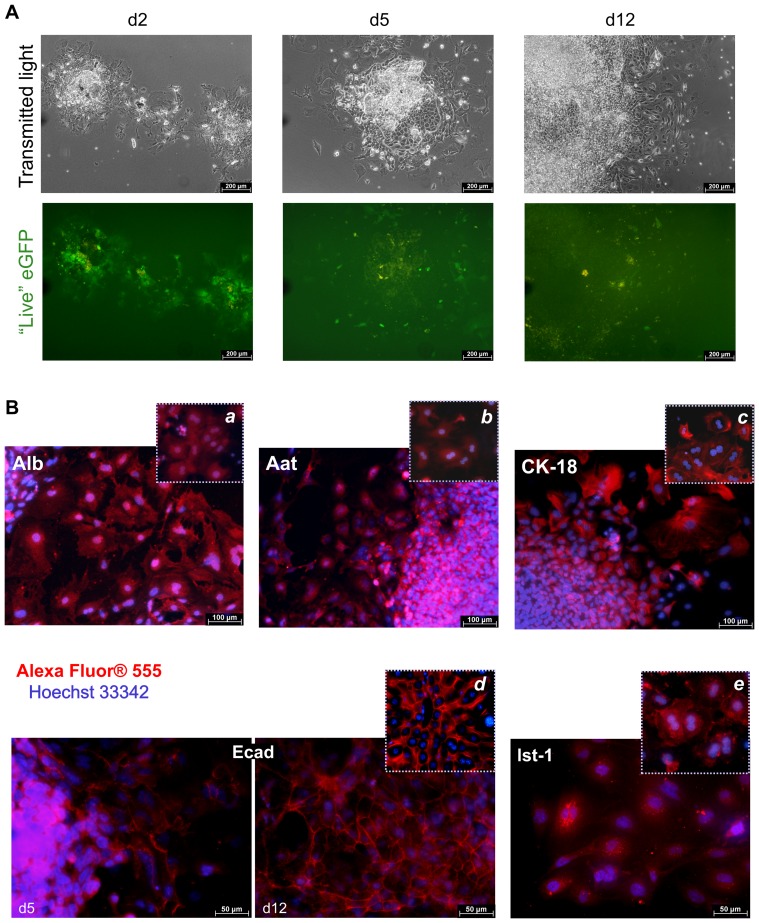
Figure 4. Expression of eGFP and hepatic proteins in spheroid-derived adherent cultures.
(A) Cell colonies outgrowing on collagen Type I matrix. Down-regulation of eGFP fluorescence during the course of the colony growth is evident. (B) Expression of hepatic proteins, using fluorescent immunoassay. For better view of Ecad and lst-1 expression patterns across the cells, the corresponding images are displayed at a magnification ×400. Respective staining of primary hepatocytes (panels a–c and e) or of a liver tissue section (panel d) are shown for comparison. Alexa Fluor® 555-conjugated IgG served as a secondary antibody; cell nuclei were visualized by Hoechst 33342 staining. Merged Alexa Fluor® 555/Hoechst 33342 images are shown. Samples treated with an isotype control antibody instead of the primary antibody stained negatively (data not shown).

