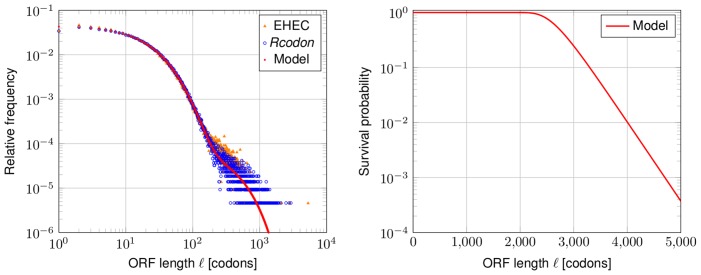
Figure 2. ORF lengths distribution and survival probability.
Left panel: Shown is the relative frequency of the EHEC ORF lengths (orange triangles) and of Rcodon (blue open dots). The prediction of the mixture model is shown in red. Right panel: Survival probability (probability to observe at least one ORF with given length  in any of the six reading frames) of the mixture model.

