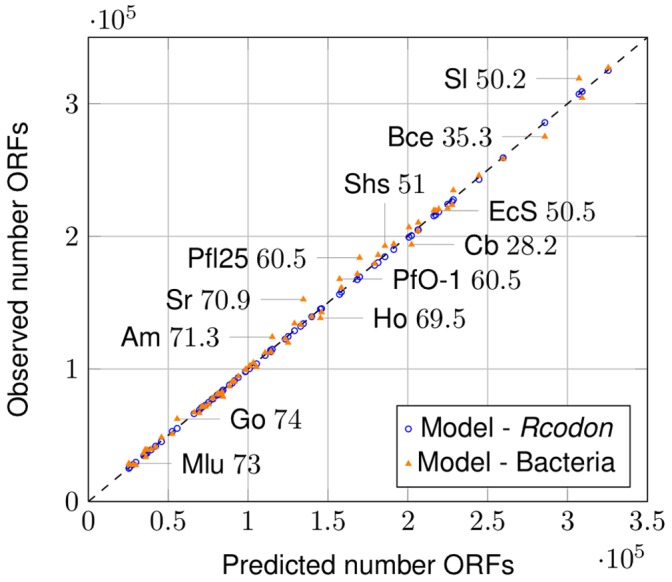
Figure 4. ORF number prediction.

Comparison of ORF numbers predicted by the mixture model to the ORF numbers found in natural genomes (orange triangles) and Rcodon (blue open dots), respectively. Some individual data points are labeled with an abbreviated species name and the corresponding GC-content according to Table S1.
