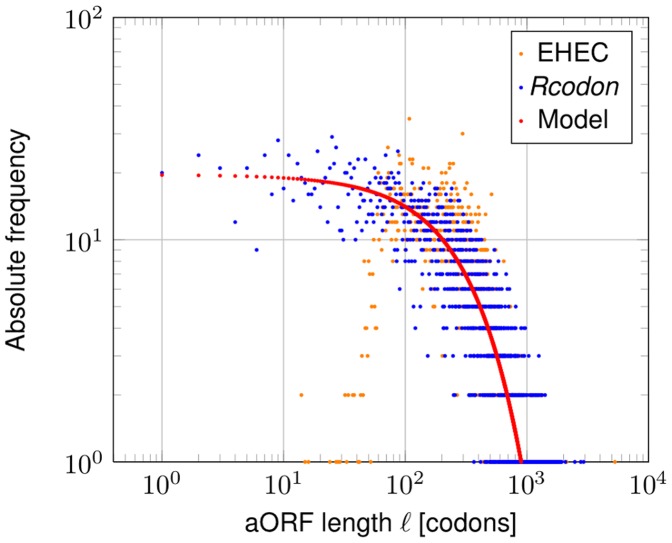
Figure 7. aORF lengths distributions.
The absolute frequency of aORF lengths in codons from the EHEC genome (NC_002695) is compared to its Rcodon and the prediction of the mixture model. The visible difference between the natural genome and the theoretical expectations either by Rcodon or the mixture model is due to the fact that short ORFs are generally less likely to be annotated as functional proteins. However, this is changing (e.g., [40]) and short ORFs are picked up for annotations more frequently.

