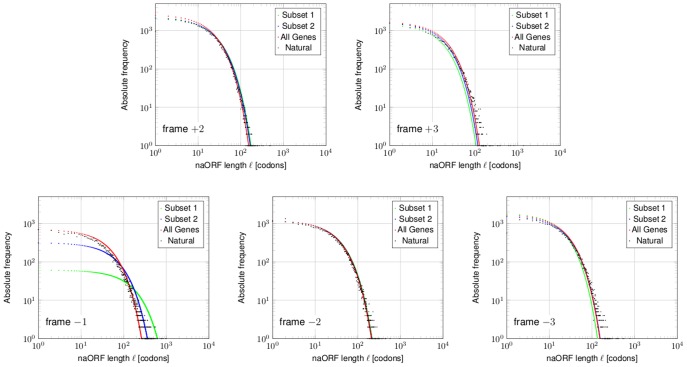
Figure 9. Length distributions of different groups of genes for each alternative frame.
Shown are the absolute frequencies of naORF lengths for the genome of E. coli MC4100 (NC_000913) as predicted by the mixture model. Each colored line represents a different group used to obtain a codon usage as input to the model. Subset 1 of very high expressed genes is shown in green, Subset 2, contains, in addition to Subset 1, further highly expressed genes and is shown in blue (data from [41]). The group which includes all genes is shown in red. Finally, the natural frequencies obtained from the bacterial genome are shown in black triangles. In most alternative frames, the expression values of the annotated frame is of negligible influence, but not so for frame −1. As Silke [38] has already stated, most, but not all, long overlapping ORFs in −1 frame might be explained by a codon usage bias for highly expressed genes. However, this finding is not true for any other alternative frame nor for genes not highly expressed.

