
Figure 4. Comparison of the effect sizes for the Genotype × Sleep Deprivation interaction across cognitive domains.
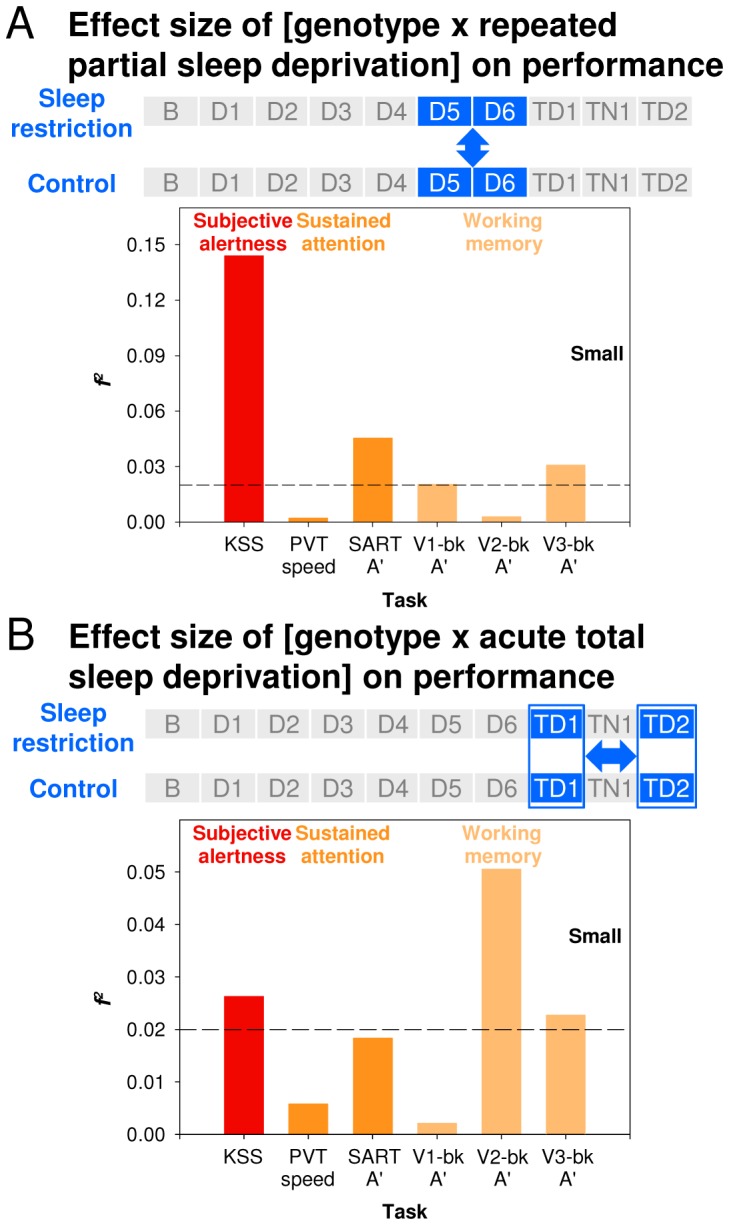
( A ) During partial sleep deprivation. It was assessed by comparing performance during D5 and D6 between conditions. ( B ) During total sleep deprivation. It was assessed by comparing performance on TD1 to performance on TD2 across conditions. Horizontal lines indicate cut-offs for small effect sizes.